

Merton College, described by students as “where fun goes to die”, has lived up to its reputation for high academic attainment by topping this year’s Norrington Table, with 45 of 77 students scoring a first in their finals. LMH is the college with the lowest score, with only 36 of 118 students achieving a first-class degree.
Regent’s Park had the lowest score of any PPH or college with more than one exam-sitting student, with a Norrington score of 69.7%. LMH narrowly missed out on the bottom spot with a score of 69.8%.
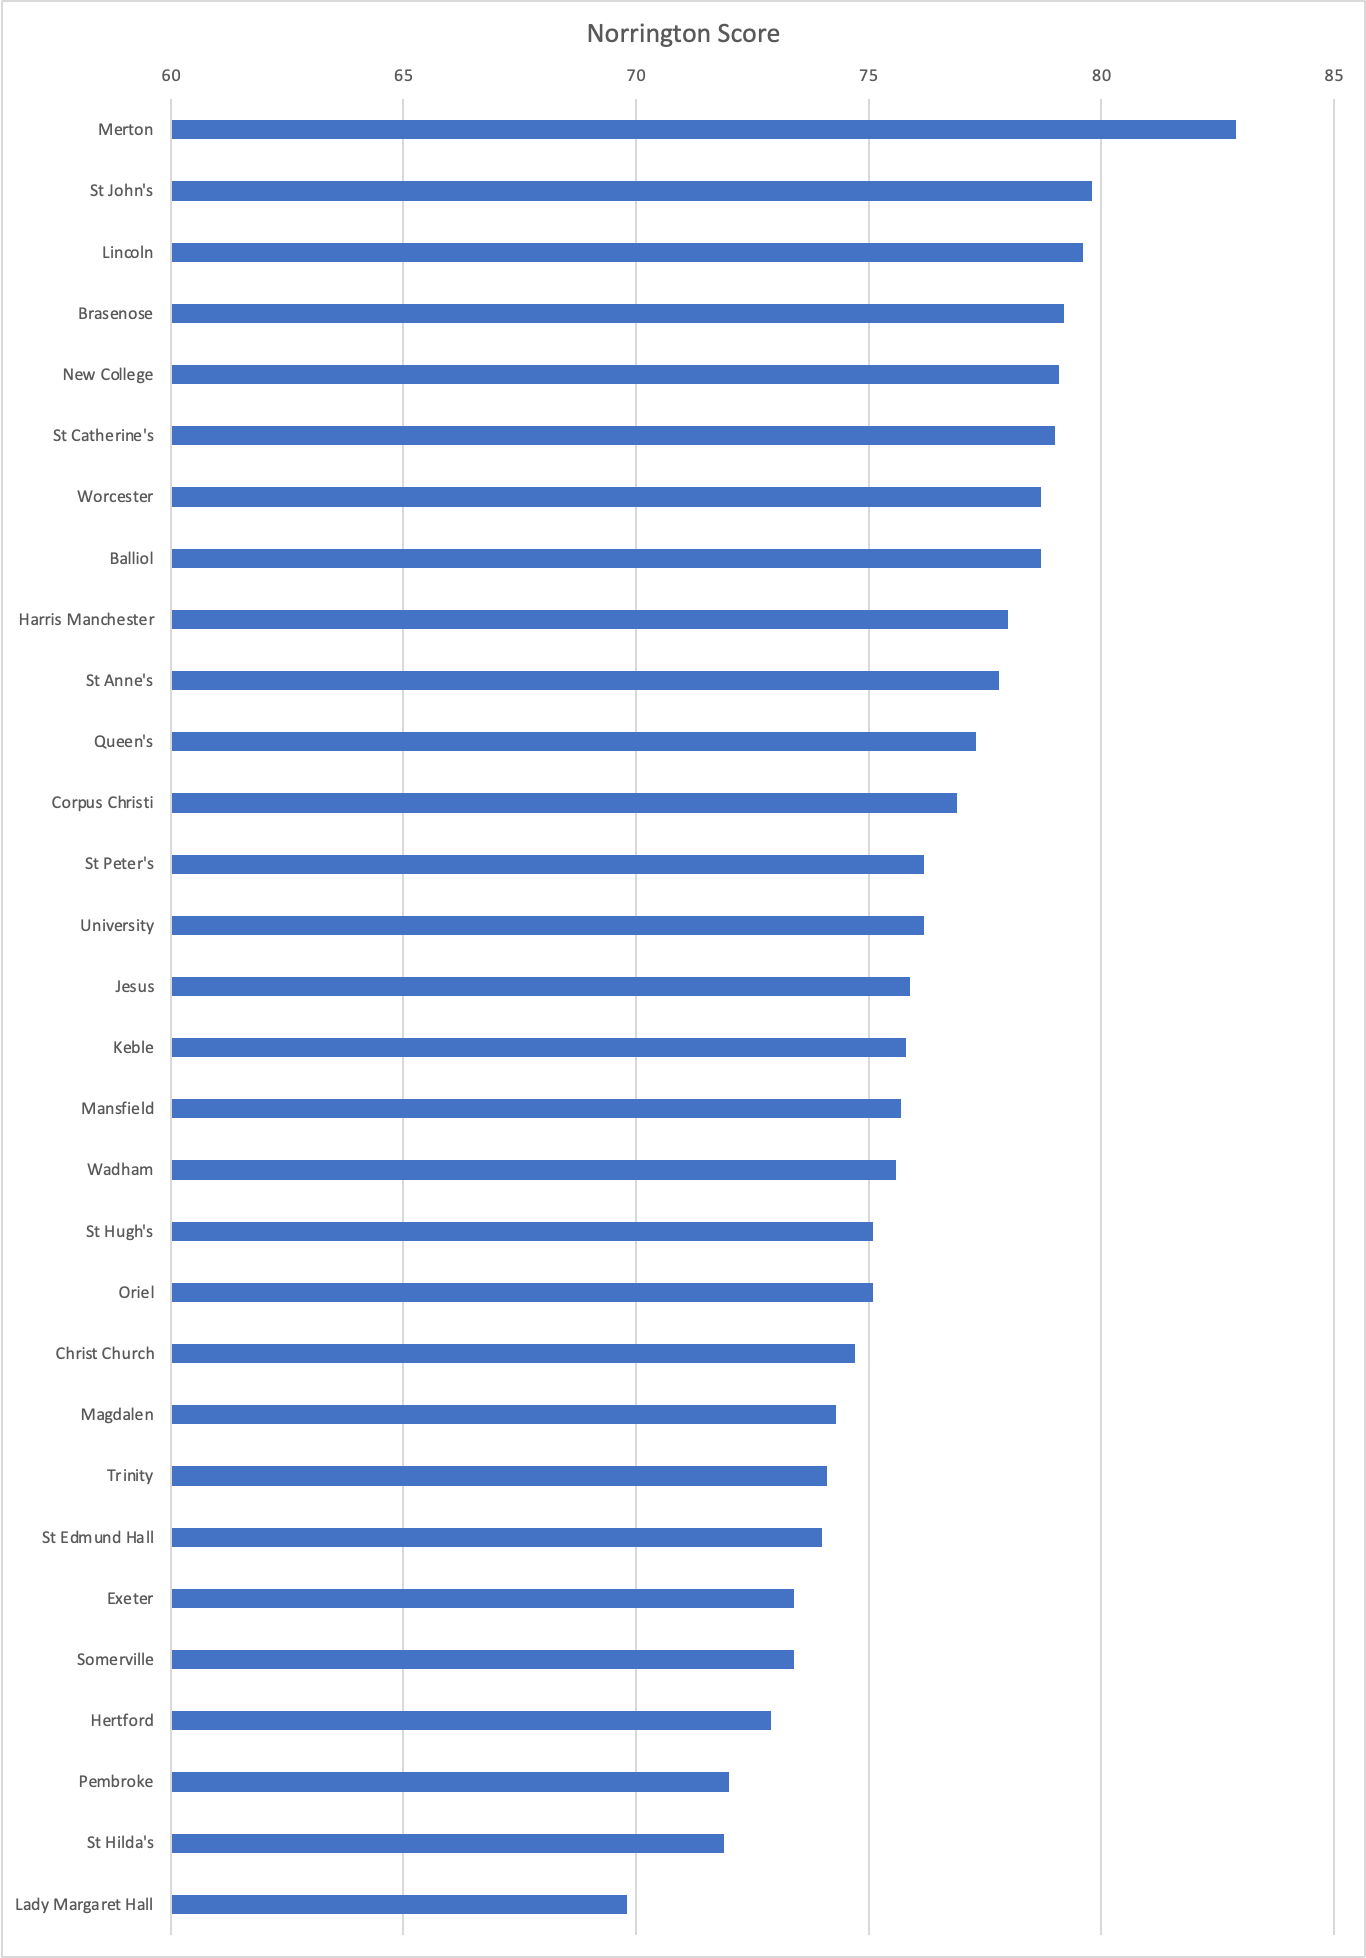
The overall lowest score on the table was earnt by Ripon Cuddesdon. This widely unheard-of college is situated 7 miles out of the centre of Oxford, nestled in the Cotswold countryside. A Church of England theological college, Ripon Cuddesdon trains men and women for ministry, with alumni including David Hand, Archbishop of Papau New Guinea 1977-83, and Cosmo Gordon Lang, Archbishop of Canterbury 1928-42. It had just one student who sat an exam in 2020-1, and because that student earnt a 2:1, the college scored just 60% on the Norrington table.
With the exception of St Stephen’s House, whose single exam entrant scored a first and earnt the House a score of 80%, most PPH’s scored lower than colleges. Indeed, the mean Norrington score for PPHs was just 70.4% compared to a mean score of 76.1% for colleges.
A Cherwell investigation in 2018 revealed that the wealth of colleges could have a substantial bearing on their performance in the Norrington Table. Looking at the data for this year, this finding seems to have held true.
The five colleges to top the Norrington Table are all among the oldest and wealthiest Oxford colleges. Merton, St John’s, Lincoln, Brasenose, and New College were all founded before 1510. Financial reports published in 2017 show that all of these colleges were in the top half of Oxford colleges and PPHs as ranked by wealth. Lincoln, the college with the lowest net assets of the five, still ranked 15th out of 36 according to wealth.
In contrast, the colleges at the bottom of the table are generally considered to be some of the poorer colleges at Oxford. Hertford, Pembroke, St Hilda’s and LMH are all in the bottom half of colleges as ranked by wealth, placing 24th, 23rd, 20th, and 31st respectively.
However, there does not seem to be a consistent correlation between the wealth of colleges and their performance on the Norrington Table. Christ Church, the second wealthiest college, was ranked 21st out of all colleges on the Table, whilst Harris Manchester, the poorest college, ranked 10th.
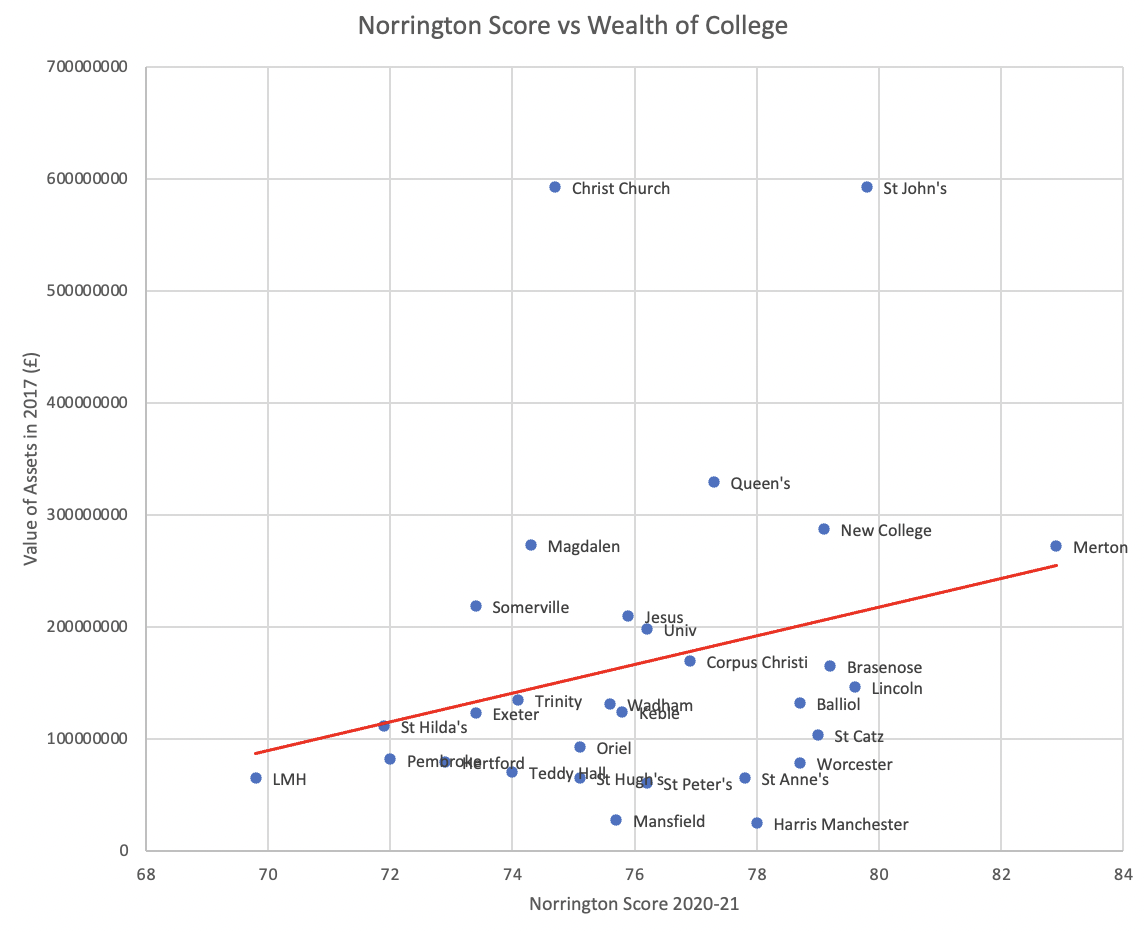
The relationship between the wealth of colleges and their academic attainment is not a new phenomenon. In 2002, the Oxford Student Union released a report stating that disparities in college wealth meant that students “are far from guaranteed a common educational experience, with detriment not only to their academic performance but also to their general welfare and financial condition”. The report found that poorer colleges had smaller libraries – with 160,000 volumes at Christ Church compared to 40,000 at Wadham – and generally paid their fellows less, making it harder to attract the best tutors.
Nonetheless, the significance of the Norrington Table as a metric of college’s academic performance has been widely criticised, since the differences between college’s scores are generally small, and a single student being awarded a 1st instead of a 2:1 could improve a college’s rank by four or five positions.
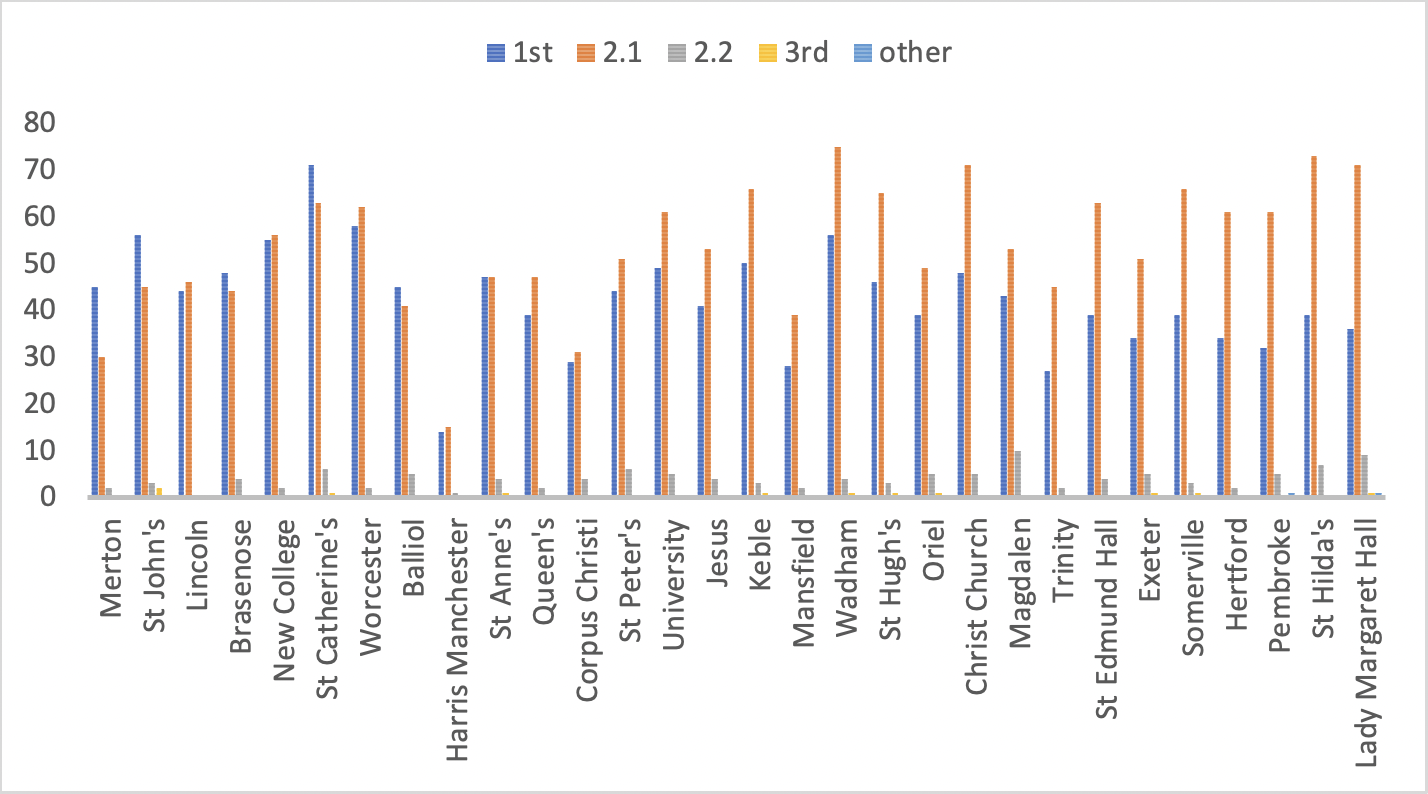
The Norrington score was developed by Sir Arthur Norrington, former President of Trinity college, in the 1960s, as a way of measuring the performance of students in finals. The score is based on the classifications of undergraduate degrees awarded and expressed as a percentage.
The Norrington calculations attach a score of 5 to a 1st class degree, 3 to a 2:1 degree, 2 to a 2:2 degree, 1 to a 3rd and 0 to a pass and Honours Pass. The percentage is then calculated by dividing the total college score by the total possible score the college could attain (ie the number of degrees awarded per college multiplied by a score of 5).
The Norrington Table for 2020-21 can be found here.
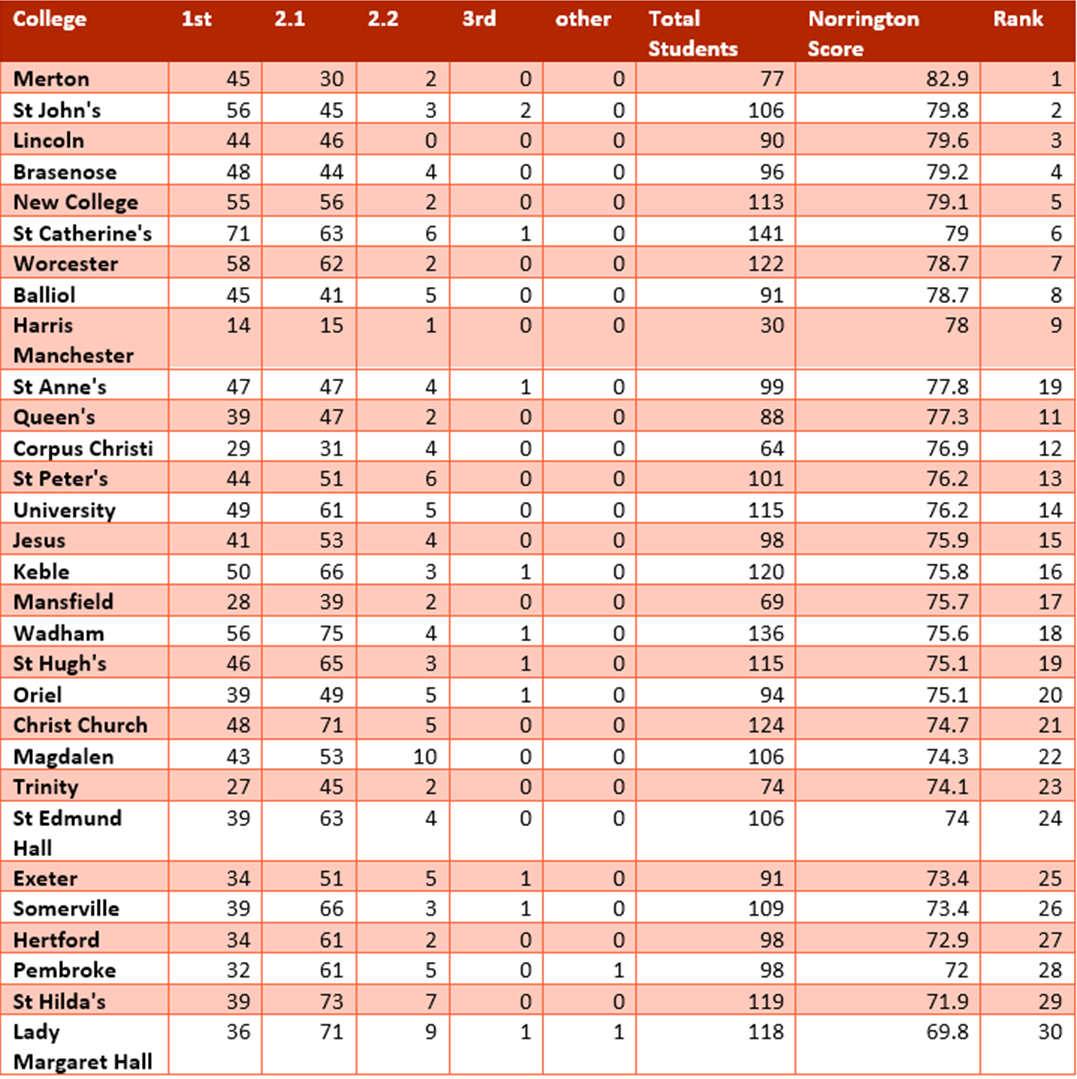
Image Credits: Meg Lintern