

Oxford University has released its Annual Admissions Statistical Report, showing progress in the numbers of students from disadvantaged socio-economic backgrounds, from state schools, and from Black and Ethnic Minority (BME) backgrounds.
The University has moved UNIQ, the state school access programme, online. There will also be a virtual Open Day and Target Oxbridge 2020 will be online.
Louise Richardson, Vice Chancellor of Oxford University, prefaces the report, saying: “The data presented clearly demonstrates steady progress towards diversifying the makeup of our student body.”
“Notwithstanding the major challenge of adapting to the constraints posed by the pandemic we fully intend to continue our progress towards ensuring that every talented, academically driven pupil in the country, wherever they come from, sees Oxford as a place for them.”
Caveats
Before a further review of the report, a few notes must be made:
- Any population-level statistics are drawn from the 2011 census
- International students are excluded from statistics on education, socioeconomic status, and ethnicity
- 6% of students choose not to disclose BME status on their UCAS applications
- The University notes in their ‘Gender’ section that the male/female distinction does not reflect the gender identity of students. Admissions statistics rely on data from UCAS, which only provides male/female options.
- Disability statistics are dependent on declaration of such in a student’s UCAS application
OVERVIEW
The admittance rate for the 2019 cycle was 14.2%. Of those students, the University states that, from 2015 to 2019:
“The proportion from state schools rose from 55.6%1 to 62.3%.
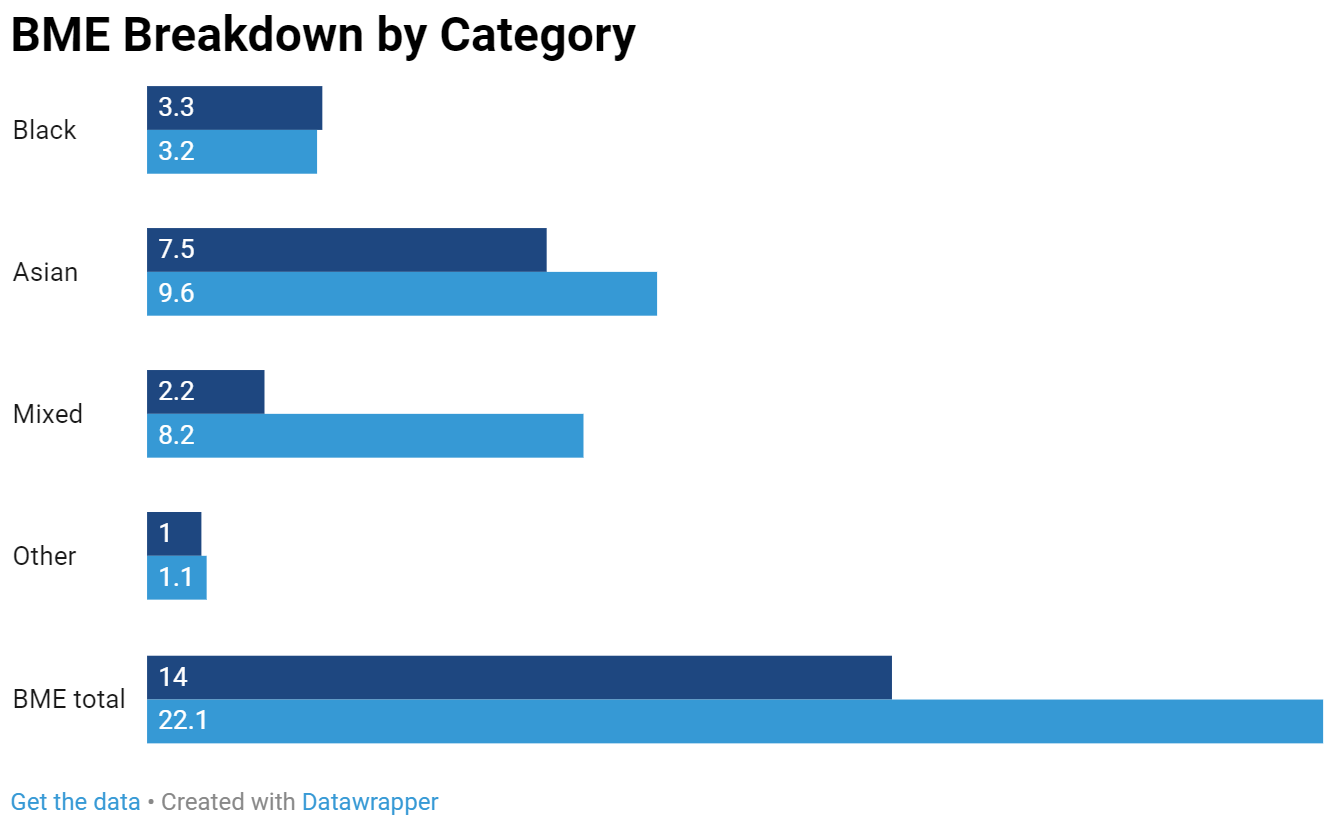
The proportion identifying as Black and Minority Ethnic (BME) rose from 14.5% to 22.1%.
The proportion from socio-economically disadvantaged areas rose from 8.6% to 12.2%.
The proportion from areas of low progression to higher education rose from 10.8% to 14.0%.The proportion declaring a disability rose from 6.9% to 9.4%.
The proportion of women rose from 47.5% to 54.4%.”
The University’s full report can be found here.
ETHNICITY
Overall, 22.1% of admitted students are BAME, compared to a nationwide 18.3%. This is the first year the university has exceeded the national average.
The representation of Black students is above 3% for the first time, rising from 2.6% in 2018 to 3.2% in 2019.
However, Cherwell finds that BME sub-categories are not in-line with national statistics. People of Asian or Mixed ethnicity are disproportionately represented.
Across courses, BME students are not admitted proportionally to their applications, except for in History & Politics, Music, and Modern Languages. BME students are disproportionately likely to apply for competitive subjects, with 27.2% of all BME applicants applying for Medicine and Law.

From the compilation of 2017-2019 admissions data, representative of the students currently resident in college, colleges ranged by 12.8 percentage points on their proportion of BME students, with Mansfield leading (26.6%) and Worcester trailing (13.8%). These are outliers, and the majority of colleges are in the high teens.
SOCIO-ECONOMIC DISADVANTAGE
The proportion of students admitted from socio-economically disadvantaged backgrounds has increased and is proportionate to the number of students achieving AAA from those groups.
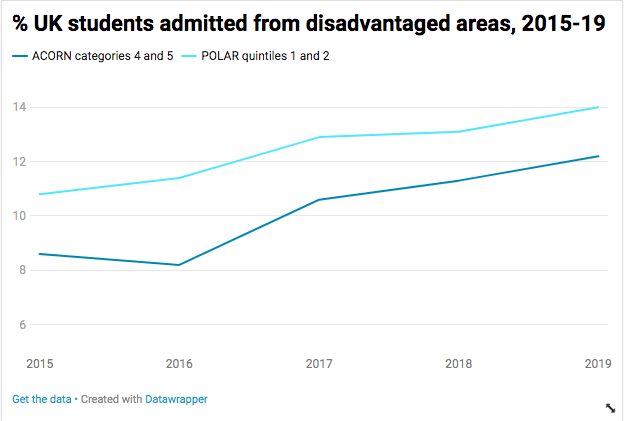
The two most disadvantaged groups based on postcode (ACORN categories 4 and 5) has increased admissions to 12.2% of total intake, which is proportional to the 12.1% of students from these categories who achieve AAA or better at A-Level.
The two most disadvantaged groups based on how likely students are to continue into higher education (POLAR quintiles 1 and 2) has also increased to 14.0% of total intake. This is a similar proportion to the 13.9% of students from POLAR quintiles 1 and 2 who achieve AAA or better at A-Level.
The proportion of students made offers from disadvantaged backgrounds who are then admitted is 76.2% based on ACORN 4 and 5 and 75.3% based on POLAR quintiles 1 and 2. This is lower than the overall rate of 84% of students with offers who are then admitted.
Subjects with the lowest proportion of students from socio-economically disadvantaged areas are Classics, Geography, and Modern Languages – though subjects differ in ranking between the two measurements.
Exeter, Somerville, and Christ Church are among the colleges with the lowest intake from disadvantaged areas.
Mansfield tops the table for most accessed by students from less-advantaged areas, followed by Merton and Lady Margaret Hall.
SCHOOL TYPE
The University states that: “The proportion of state-school students admitted to Oxford has risen to 62.3% in 2019, having increased from 55.6% in 2015. This is the highest figure ever recorded.”
Notably, for the first time, all colleges admit over 50% of their students from state schools. Mansfield College has the highest proportion of state school applicants, at 94.0%. Christ Church and Queen’s have the lowest proportions, at 50.2% and 50.9% respectively.
However, 71.6% of A*A*A or better grades are achieved by state school students, meaning the University’s 62.3% admission rate is not in proportion to the number of high achieving state-school students.
There is also a disparity in offer and admission rates. State school students were made 64.5% of the offers for the 2019 admissions cycle. 81.6% of state school students who were made offers were then admitted, in comparison to 89.7% of independent school students.
Classics has the lowest intake of state school students, at 28.6%, with Theology and Religion as the next lowest subject at 47.6%.
The report notes that state school students are more likely to apply for the most oversubscribed subjects – E&M, Medicine, PPe, Law, and Mathematics – while independent school students are the most likely to apply for the least competitive courses.
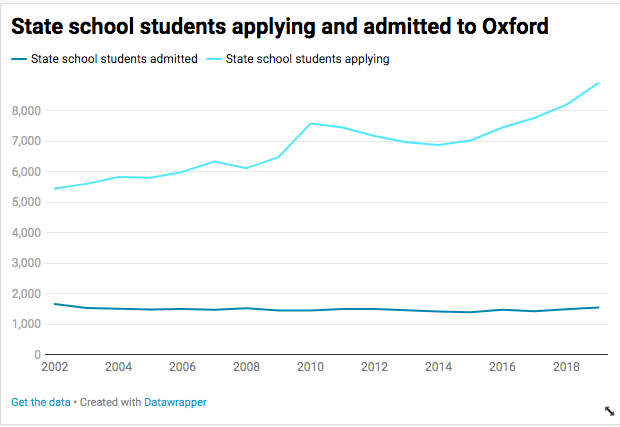
Cherwell finds that while the proportion of state school students accepted among UK domiciled students has increased substantially over the past few years, the absolute number of state school students has not changed much over the past 20 years.
The number of state school students at Oxford peaked at 1671 in 2002, decreasing to 1404 in 2015, and reached 1557 in 2019.
While the number of state school students applying has increased from about 5500 in 2002, to 6500 in 2009, to almost 9000 in 2019, the increase of state school intake has not been proportionate. As such, the state school proportion has not changed much. It was about 45% in 2009, and is 47% in 2019.
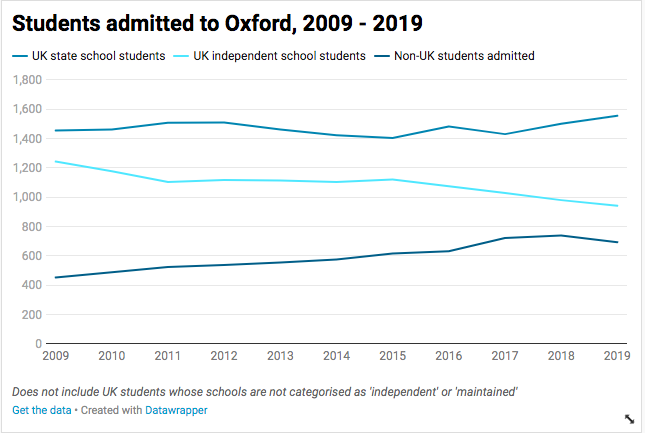
This is in comparison to a decrease in independent school students admitted, dropping from 38.9% to 28.7% in the last ten years.
This has been balanced by an overall increase in non-UK students admitted: from 454 in 2009 to 739 in 2018. Notably, in 2019 the number of EU students admitted decreased, and overall non-UK admissions dropped 694.
GENDER
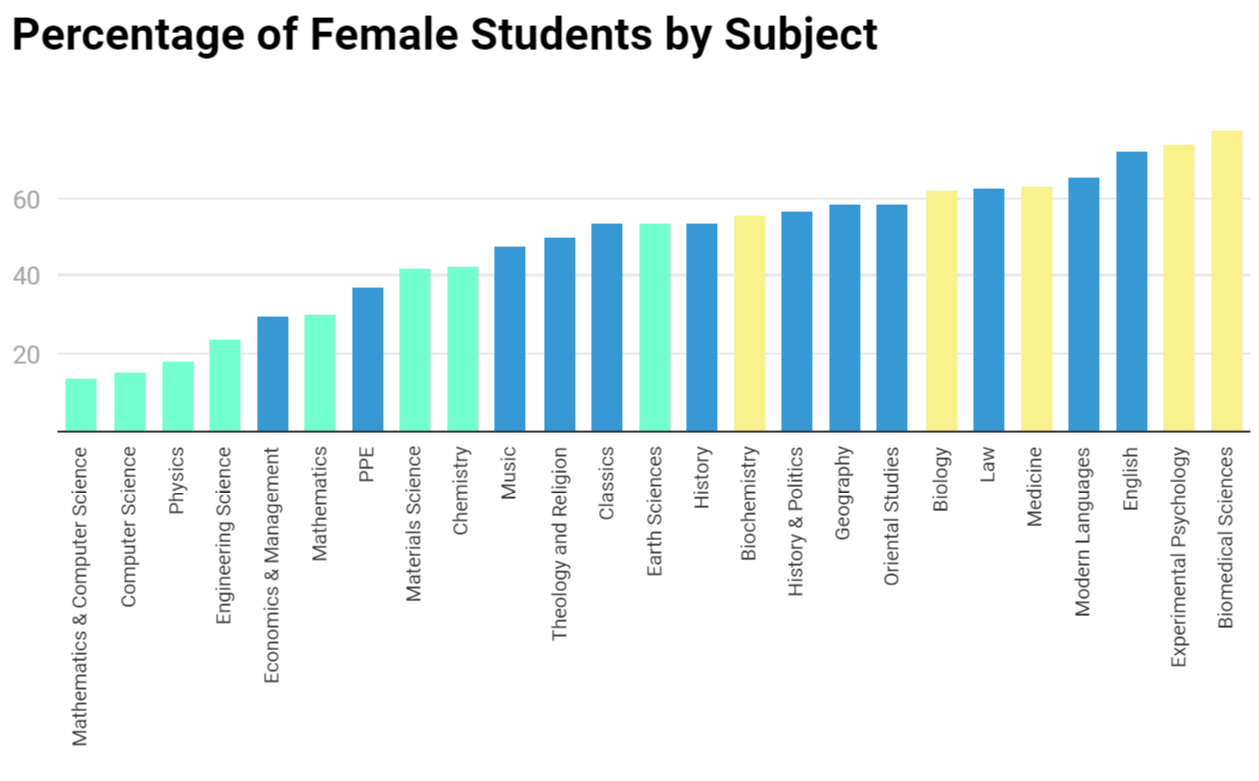
The proportion of female students has steadily risen since 2017, when it rose above 50% for the first time. In 2019, 54.4% admitted students were female.
Biomedical Sciences (77.3%) was the most female, while Maths and Computer Science (14.0%) had the fewest women.
DISABILITY
The university states that, “In 2019, 9.4% of admitted students had declared a disability on application, 2.5 percentage points higher than in 2015.”
From 2018-2019 the number of UK students with known disabilities admitted rose 0.2 percentage points. In contrast, in 2017-18 the number of students with known disabilities rose 2.2 percentage points.
Oxford lags behind the UK university average in terms of the proportion of students admitted with known disabilities. The UK university data shows that 14.1% of admitted students declared a disability in 2017, higher than Oxford’s 9.4%.
Over half of students (55.25%) with known disabilities admitted between 2017 and 2019 have either a learning difficulty (including dyspraxia, dyslexia, and ADHD) or a mental health condition. Only 20 of these 677 students use a wheelchair or have other mobility issues.
NATION AND REGION
One of the report’s main conclusions was that “UK-domiciled applicants are substantially more likely to receive an offer of a place to study at Oxford than students from outside the UK.”
78.8% of admitted students were UK-domiciled. Of the remaining 21.2%, 7.1% are EU students and 14.1% from outside of the EU.
The percentage of international students admitted to Oxford in 2019 is higher than the percentage for all UK universities in 2017, which sits at 16.1%.
This year brought a small increase in the number of domestic students, up from 77.7% in 2018. However it continues to represent a drop since 2015, in which 80.8% of students were based in the UK. The highest number of both overseas applications and admitted students was from China.
The report states: “Oxford does not operate quotas or targets around the nationality or domicile of students admitted to the University. The exception is Medicine, which is subject to a government restriction on the number of students with international fee status who can be admitted each year.”
Examining the geographical data of UK-domiciled applicants, the access report found that London and the South East made up 47.7% of applications 2017-19, as well as 49% of students admitted.
Greater London has 18.8% of UK pupils with grades AAA+ or higher, but over the three years 2017-2019, 26.5% of the intake came from this region. Both the South East and South West regions were also overrepresented in the 2019 intake.
Meanwhile, Northern Ireland, which has 4.6% of AAA+ pupils, only made up 0.8% of admitted students. Similarly, Yorkshire & the Humber has 6.4% of pupils with these top grades, but only represents 4.8% in admitted students at Oxford.
The full report is available here.
Image credit to Mike Peel/ Wikimedia Commons.